Wednesday, January 11, 2012

Installing SQL CE on my dev machine (x86)

I’m running VS2010 Express (C#). After downloading and installing SQL Server CE (3.5) on my 32-bit machine, created a simple app, added a reference to System.Data.SqlServerCE, and expected it to “just work”. It didn’t.

PROBLEM #1: At the point of instantiating a new SqlCeEngine, a SqlCeException was thrown:

“Unable to load the native components of SQL Server Compact corresponding to the ADO.NET provider of version 8080. Install the correct version of SQL Server Compact. Refer to KB article 974247 for more details.”

The Inner Exception stated:

“Unable to load DLL 'sqlceme35.dll': The specified module could not be found. (Exception from HRESULT: 0x8007007E)”

As for the outer exception, the KB article implies that this should only be a problem on a x64 system. It provides no help for those who encounter this on a 32-bit system. So I turned my attention on the 'sqlceme35.dll' referenced in the inner exception. I found this dll located at the root of the SSCE installation folder (C:\Program Files\Microsoft SQL Server Compact Edition\v3.5). So why can’t VS find it?

[Of course, I could add the SSCE install folder to my System Path (env var). But this solution won’t work during deployment.]

I tested several options to try to resolve the problem:

  • Test #1: copied 'sqlceme35.dll' to [solution]/bin/debug folder
  • Result: This of course avoids the exception, but we shouldn’t have to do this manually. (Note: The introductory documentation doesn’t even mention this requirement).
  • Test #2: Tried to add a Project Reference to sqlceme35.dll. (using the “Browse” tab in Add Reference dialog).
  • Result: Failed (“Reference…could not be added. Please make sure that the file is accessible, and that it is a valid assembly or COM component.”) Seems that dll is not a .NET assembly (as explained here)
  • Test #3: deleted 'sqlceme35.dll' from Test1 and copied it to the application folder (recommended here). Rebuilt
  • Result: failed.
  • Test #4: deleted 'sqlceme35.dll' from Test3 and copied it to the %WINDIR%\System32 folder (rec’d here)
  • Result: Succeeded; but seems way too intrusive. If this was necessary, why didn’t the SSCE installation msi do this for me?
  • Test #5: deleted 'sqlceme35.dll' from System32 (Test4) and added it to the Solution in VS (rec’d here and esp here). I.e., r-click on project in Solution Explorer, “Add Existing Item”, navigated to SSCE install folder and selected sqlceme35.dll. (NOTE: Using dropdown arrow, I selected “Add As Link” (see instructions here). Had to change the Project Output to “Copy If Newer” (as rec’d above). (Note: that option was greyed out until I stopped debugging). this transfers the dll into the appropriate output folder (e.g. /bin/debug)
  • Result: Succeeded! Will need to do this for all 8 SSCE dlls

PROBLEM #2: Although the results are functional, it really “uglifies” my solution tree. I tried putting the dlls into a folder named SqlCeLib, then repeateating test 4+4b – failed! The “Copy if Newer” functionality copied the tree structure into the target bin, including the parent folder (SqlCeLib)! So the resulting executable couldn’t find the dlls! But this page says it should work!

Solution#1: after re-reading that page, I decided to try creating the folder again, but calling it X86. Lo & behold, it worked! But WHY??

Solution#2: Rather than use the “Copy if Newer” functionality (and changing that setting back to “Never Copy”), I instead added the following Post-build event (rec’d here; From project properties, Build Events tab, add the following to the Post-build event command line):

copy "$(ProjectDir)\SqlCeLib\*.*" "$(TargetDir)"

This works, but only with actual copies of the dlls. It doesn’t work with Links. But upon reflection, I think I don’t want to use links after all. It removes control in the app itself to control exactly which versions of the dll are currently being built against. So I think this will be my go-forward plan.

Thursday, November 19, 2009

Flocking behavior

300,00 birds in an extraordinary emergent dance.

Friday, September 11, 2009

Identifying “thought-leaders” among blogs

I suppose it is a bit late in the game to be suggesting altenative metrics for blog analysis. If only we had more time…

Nevertheless, this site purports to list and rank the “thought-leaders” in an entirely different domain: church & ministry blogs. What intrests me most here is the methodology they used, which is described at the bottom of their page. In essence, they’ve scored each blog based on the combined weight of these 6 metrics:

  • Alexa Rank
    The site with the highest combination of users and pageviews is ranked #1.
  • Compete Visitors
    The number of unique visitors that visited the website in July 2009 according to Compete.
  • Google PageRank
    Votes cast by pages that are themselves “important” weigh more heavily and help to make other pages “important.”
  • Google Reader Subscribers
    The number of Google Reader users that subscribe to each blog.
  • Technorati Authority
    Authority is determined by the number of unique blogs indexed by Technorati that have linked to that blog in the past 180 days.
  • Technorati InLinks
    The total number of links that a blog has received.

It certainly would be interesting to see how our methodology compares to this one.

Thursday, August 27, 2009

Ancient networks

Just came across what I believe must be the oldest reference to Scale Free social networks:

“Whoever has will be given more, and he will have an abundance. Whoever does not have, even what he has will be taken from him.”

-Jesus (Matt. 13:12)

Monday, August 3, 2009

Visualizing Information with .NET

Laurence Moroney, senior technology evangelist with Microsoft & Silverlight expert, explains how to use .Net for creating what he calls "data-agnostic" visualizations. You Java users won't be overly impressed (well, neither was I), but it's a good start and he includes some helpful tips.

Due to data agnosticism, he can simply tweak a config file to generate an entirely different chart.

For those visualizers that are starting out with .Net, it's a good intro.

Monday, June 22, 2009

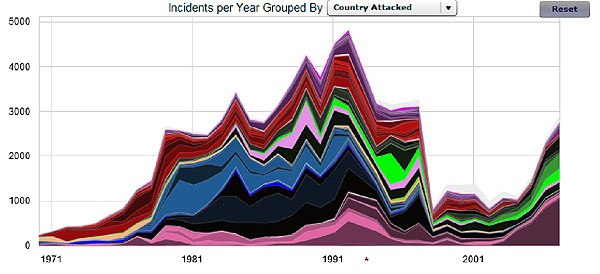
Newly released: Global Terrorism Database

The GTD just released its latest an open-source database -- structured (& unstructured) details about 80K terrorist attacks from 1970 through 2007 (with annual updates planned for the future). It includes systematic data on domestic as well as international terrorist incidents that have occurred during this time period. The previous dataset provided info through 2004. You can see the latest one here.

The site is designed for interactive research through the web. But as the FAQ explains: "United States government officials and interested researchers can request a copy of the GTD data files from the March 2009 release through the GTD Contact Form."

There is also a nifty interactive visualization tool called "Data Rivers." Click through below to play with it.

GTD Data Rivers

Tuesday, May 12, 2009

Twitter Firehose (almost)

This site just posted a demo of the current state of the Twitter firehose. It is still just a sampling of the full stream – a “statistically insignificant” percentage. They discuss it briefly in their blog. Still, it gives a good idea of what the hose will look like eventually.

“Spritzer is the name of one of the requests that can be made to HoseBird, the Twitter streaming API.

Sunday, March 1, 2009

Visualizing Social Media Search

A couple interesting apps. May come in handy if we ever want to actually draw pictures of all this stuff:

The Social Collider

social_collider.jpg

The Social Collider [socialcollider.net] data visualization reveals cross-connections between conversations on Twitter. One can search for usernames or topics, which are tracked through time and visualized much like the way a particle collider draws pictures of subatomic matter. Posts that did not resonate with anyone just connect to the next item in the stream. The ones that did, however, spin off and horizontally link to users or topics who relate to them, either directly or in terms of their content. The project is part of the Google Chrome Experiments website, and thus developed with Javascript only while the code is open-source. Note: It seems to use a lot of processor power.

Top Twitter Friends

Top Twitter Friends

A web service that creates a visual map for any Twitter account of the other accounts it is most frequently used to converse with. The site uses the Mailana social network analysis system to analyze Twitter conversations and come up with the data for the visualization.

Marshall Kirkpatrick recently used the Top Twitter Friends web application to generate an analysis of a series of popular twitterers, complete with lists of each Twitterer's most frequently contacted friends, and a screenshot of their visualization. Marshall's perspective is that the openness of this information gives us some pretty intimate insight into the inner circle of influential people in our social networks, and those of notable people.

Not only can you see who people most frequently converse with, but clicking the info link beside a person's account name reveals a tag cloud of the most commonly used words in the conversations between the two Twitter accounts in question, plus an additional link to actually go and read the conversations between them.

Monday, January 19, 2009

Tracking Wikipedia Edits

I'll definitely want to keep an eye on this site and the author's methodology. Looks very interesting. (Albeit a bit dated. Interest in the site appears to have peaked a couple years ago.)


From the site:


"Wikirage is a tool that tracks the entries in the Wikipedia that are getting the most edits over different periods of time. I started this project to see if I could find an alternative to traffic data for judging Internet trends. I was very impressed with the results and how they mirror what is going on in popular culture."

Time-Lapse video of Flight 1549 On Wikipedia: 90 Minutes; 176 Edits

Came across this 3 minute video which dramatically demonstrates the speed and power of social media. This is a time lapse video containing screen captures of the Wikipedia page about Flight 1549. It portrays 176 different edits to the page which occurred in the first 90 minutes after the crash:

Original source: DailyMotion video
My source: this airline blog

It occurs to me that the same simple technique could be used to capture the dynamics of any actively breaking news story on wikipedia. The author used Screengrab extension for Firefox and Apimac Slideshow. Then it appears he just iterated through the history of pages stored on the Wiki site. We ought to do this for the next big news story. For example, I notice that on the wikipedia Mumbai Attacks page, there were 328 edits in the first six hours. Discounting the "minor" edits there were still 85 major changes.